BHplot

Overview:
BHplot has been originally developed for the online analysis of USAXS data taken with the Bonse-Hart set-up at the beamline ID2 (ESRF). The software can treat the data format created by the 'bhscan' macro implemented in SPEC. The logarithmic angular scale (ltth) is automatically converted to a q scale in nm-1: q=4*pi/wavelength * sin(10ltth/2*1e-6) and the intensity scale is normalized.
Moreover, BHplot is optimized for handling azimuthally integrated SAXS/WAXS data recorded at ID02 beamline. A direct link to the BHfit routines allows fitting of polydisperse form and structure factors.
In addition, it is possible to plot any multi-column SAS data. Columns for q, intensity and variance can be selected via the columns button (see description below).
Description:
- choose directory
Select your data directory or type it directly in the corresponding input box. Note that you can start BHplot from the command line to define a starting directory: SAXSutilities.exe [starting_directory] BHplot
- choose background
Select a background measurement of the experiment. If the checkbox subtract is activated, the measurement is subtracted from all selected files in the data listbox.
Choose bh data only if you want to subtract only from Bonse-Hart data sets (specific *.txt format). This is in particular useful for comparing BH-USAXS with pinhole SAXS data during an experiment.
If subtraction is not activated, the background file is dispayed with a thin black line. This can be disabled using the show check box.
- data listbox
Select up to 200 data sets for simultaneous plotting. A unique colouring is available for 10 files.
The list box shows the file names as well as the title of the measurement (if 'details' is checked).
Data recorded at ID02 beamline are usually saved in files using spec format ([expertiment]_[detector number]_ave.spec). Data sets within these files are only displayed if 'details' is checked.
In case of a combined SAXS/WAXS experiment, spectra with the same image number taken with two different detectors can be automatically displayed together. Activate 'link SAXS/WAXS' check box and select the correct WAXS detector number from the Setup menu. In this case, only the SAXS detector files are displayed and the WAXS data are automatically appended.
Data stored in the [expertiment]_[detector number]_ave.spec files can be splitted into separate files using the Analysis menu (see description below) and treated further using DataTools (e.g. merging of SAXS/WAXS data, averaging, background subtraction etc.).
- filter
Two filter input fields are available:
1. The first filter is applied to the file names. Wildcards have to be used: e.g. * to display everything, etc. This option can be used to reduce the number of displayed items, which increases the working speed of the program.
2. The second filter searches substrings within the filename and within the sample description. Use this filter to compare samples: e.g. search for water to compare all background measurements...
Use update list to activate a filter and to update the file list.
- buffer data
The program uses an internal buffer in order to speed up updating of the file list and plotting of data. If checked, all sample descriptions and data files are keep in this buffer and are reused if plotted a second time. This speeds up creating of the file list especially when the 'details' box is checked.
The buffer should be cleared ('clear buffer' button) if the buffer file gets too large (>10MB) or in case you are modifying data files externally.
The buffer is automatically cleared when restarting the program.
ATTENTION in case you are modifying files externally (not changing their file name): switch off buffering to make sure that you plot the right information !
- plot
Plot the measurements selected in choose background and the data listbox. Multiple data sets can be selected. If choosing only one file, the prev. and next buttons can be used to scroll through your measurements.
Different plot modes are available from the menu (log, lin, Guinier, Porod, etc.) - see below.
An appropriate axis description can be defined in the Setup menu.
In case of Bonse-Hart data (*.txt format) a q scale in nm-1 is used. The intensity scale is normalised to absolute intensities by the BH scaling factor. Correct BH absorber calibration should be supplied in the Setup menu.
- columns

This GUI serves to select the columns containing x and y data (usually q and intensity) as well as the variance of the measured intensity. Plotting of the variance can be activated using the variance check box.
The program distinguishes two types of data:
1. general ASCII data with one data set per file (left three columns) and
2. [expertiment]_[detector number]_ave.spec type files containing multiple data sets (three columns on the right)
NOTE: column names of the spec file are taken from the last data set in the last analysed *ave.spec file.
- export
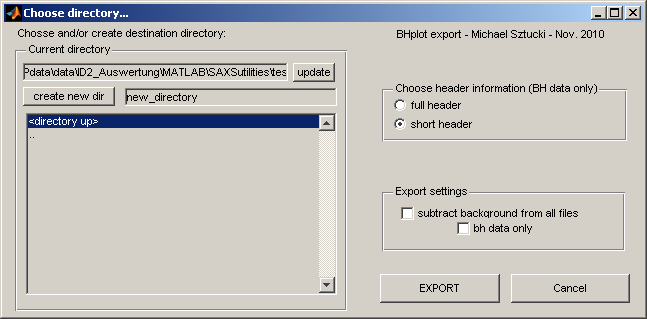
This function allows to export the selected data sets. It can be used to:
1. export the treated Bonse-Hart data with a q scale in nm-1 and normalised intensities.
2. save background subtracted data (consider using DataTools for a large number of data).
3. extract data sets from a *ave.spec file (consider using the split function in the analysis menu for a large number of data)
4. extract two columns (plus variance) from a multicolumn file (select the columns with the column button).
The target directory can be chosen (and created respectively).
For the output of Bonse-Hart header information two possibilities are available:
1) 'full header': the full header as in the raw data is saved
2) 'short header': the title (given during the 'bhscan') is put as a label of the intensity column.
- cross hair on
This button toggles between cross hair and zoom mode. Click on the graph to select a point. --> The coordinates will be marked on the graph. Use the plot button to erase the marked coordinates. In this mode the zoom function is disabled.
- show legend
Enables and disables the plotting of a legend.
The legend can be either the file name or additionally the sample description. This can be selected in the Setup menu.
- keep zoom
Does exactly what it says
- variance
Plots error bars if supplied in the files. Columns for q, data and variance can be selected using the columns button.
- print
Prints the current graph to a printer.
- help
Shows this help.
- close
Closes BHplot.
- fit data
All plotted data are transferred to the fitting routines available in BHfit.
Available menu options:
data menu:

You can save the selection within the data listbox for later use.
The other menu items should be self explaining...
analyis menu:

This menu is a simple means to determine a slope in a log-log plot and to determine the Guinier radius from a Guinier plot
The last menu item is used to split the data sets contained in a [expertiment]_[detector number]_ave.spec file into separate files. The columns for q and intensity are automatically chosen. Header information can be added as defined in the split options.
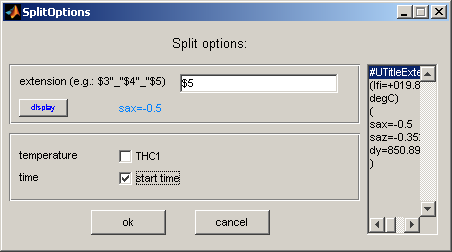
The temperature recorded with thermocouple 1 and a time stamp can be added by checking the according boxes.
The upper input field allows defining the information in the title of the 'data' column.
The title is always composed of the title defined during the experiment (given in ccdexpose etc) and an additional term derived from further meta data. These meta data are contained in the header line UTitleExtension and are displayed on the right side of the SplitOptions GUI (separated by spaces).
The information of each line can be added by $[line number]. Several items can be separated with strings of the type "[any character, but avoid space character]".
For example:
$4
$4"-"$3
Click on display to get a preview.
NOTE: The GUI displays TitleExtrension key of the last dataset of the most recent *ave.spec file read. Earlier datasets might have a different composition of this key as its composition can easily be changed during an experiment. At the end the number of the space separated element is the reference!
plot modes:

Selection of plot modes and if to display symbols on the screen and in print.
setup:

show PBBA reference:
The reference position of PBBA peaks will be displayed. The input field shift q scale (multiplicative) allows to fine tune the distance calibration.
do not clear screen:
This option might be useful to compare quickly files from different directories.
The other options have been described above.
programs:
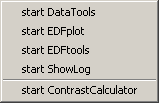
Start other programs of the SAXSutilities package.
help:
Get (this) help and updates.